
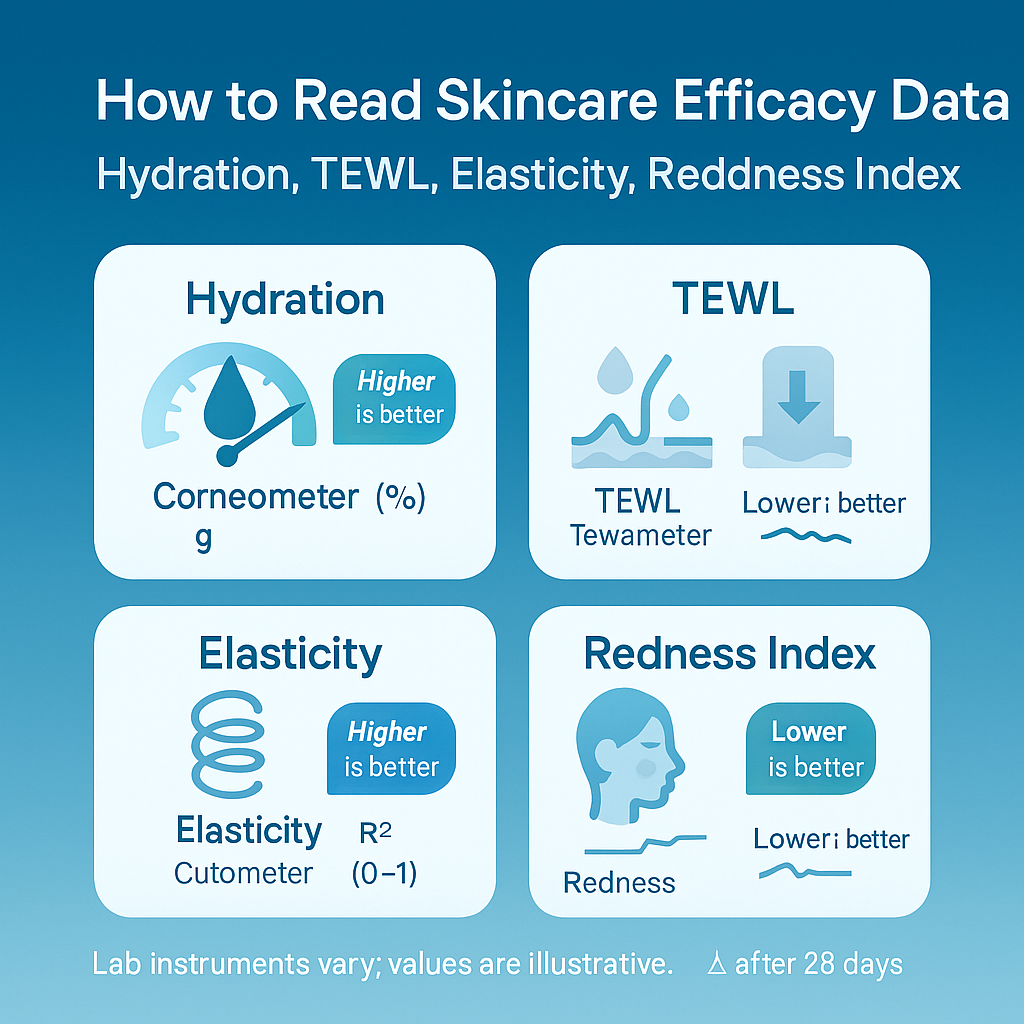
How to Read Skincare Efficacy Data: Hydration, TEWL, Elasticity, and Redness Index
The 2013 Nobel Prize clarified the core machinery of cellular vesicle trafficking—essentially an operating manual for understanding, generating, and releasing exosomes. It opened wide the possibilities for skin care and aesthetic use, and exosomes are now considered one of the most important approaches to overcoming regeneration and repair bottlenecks in the 21st century.
Why look at metrics instead of just photos?
Lighting, distance, and camera processing all skew perception. Converting change into repeatable numbers is how you judge whether a plan (e.g., microneedling + fresh-reconstituted exosomes) truly works—or just “looked good in the moment.”
Four common metrics—what they mean
1) Hydration (Corneometer)
-
What it is: Water content in the stratum corneum (the outer barrier).
-
How it’s measured: Corneometer; reported in arbitrary units (AU). Typical baseline: 30–60 AU.
-
Readout direction: Higher is better (and persistence matters).
-
Meaningful change: ≥10–15% increase usually feels softer and looks glowier.
-
Reduce noise: Measure 15–20 min after cleansing; sit quietly in 20–24 °C, 40–60% RH before testing.
2) TEWL (Transepidermal Water Loss)
-
What it is: The rate at which water escapes through the skin—gold-standard for barrier stability.
-
Unit: g/m²/h.
-
Readout direction: Lower is better.
-
-
5–15: typically stable
-
15–25: elevated—barrier under stress
-
>25: often impaired/early post-procedure
Rule-of-thumb ranges:
-
-
Meaningful change: 15–30% decrease often correlates with less tightness/redness.
-
Reduce noise: No skincare 2–3 h prior; avoid exercise, caffeine, hot showers; rest 10–15 min before testing.
3) Elasticity (Cutometer)
-
What it is: Speed/extent of rebound after negative-pressure suction—relates to “tight,” “bouncy” feel.
-
Key parameters: R2 (overall elasticity, higher is better), R7 (elastic recovery, higher is better).
-
Meaningful change: +5–10% in R2/R7 is often visible and tactile within 2–6 weeks.
-
Reduce noise: Fix measuring points; 3 repeats per site, use the average.
4) Redness / Erythema Index (e.g., a*)
-
What it is: Degree of local inflammation/irritation; from colorimetry (a*), or image-based red-area counts.
-
Readout direction: Lower is better.
-
Technique tips: Fix ROI (region of interest); same angle, light, and distance each time. Decreases in red area or a* suggest less irritation and fewer triggers for post-inflammatory pigmentation.
Evidence grading: how to read A / B / C / R
-
A — Strong
Randomized, blinded, adequate sample (e.g., n ≥ 30), standardized instruments (Corneometer, Cutometer, etc.), p < 0.05, follow-up ≥8 weeks.
Trust level: Robust, generalizable, supports causal inference.
-
B — Moderate
Split-face or open-label; smaller sample (n ≈ 15–30); statistical significance; 4–8 weeks.
Trust level: Decent; good for planning routines and cadence.
-
C — Weak
Single-arm pre/post with n < 15, or in vitro/ex vivo/animal data.
Trust level: Directional hints only; needs higher-grade confirmation.
-
R — Real-world
Anecdotes, KOL posts, uncontrolled before/after photos.
Trust level: Inspiration; validate against A/B-level data.
Quick read: “Hydration ↑14%, TEWL ↓22%, R2 ↑8%, redness ↓35%, n=40, randomized, double-blind, 8 weeks” = essentially an A-level combo.
“n=12, single-arm, 4 weeks” = likely C-level; treat as directional.
Which metrics matter most for different goals?
|
Goal |
Post-procedure Days 1–7 |
Weeks 2–4 |
Weeks 4–8 |
|---|---|---|---|
|
Calm & stabilize after microneedling |
TEWL ↓, Redness ↓ first; Hydration ↑ second |
TEWL continues down; redness stable |
Shift toward structural recovery |
|
Dewy, hydrated look |
Hydration ↑ shows fastest |
Hydration stabilizes; TEWL ↓ |
Elasticity (R2/R7) ↑ |
|
Early aging / fine lines |
Keep TEWL from worsening |
Elasticity ↑ begins |
Elasticity climbs; redness stays low |
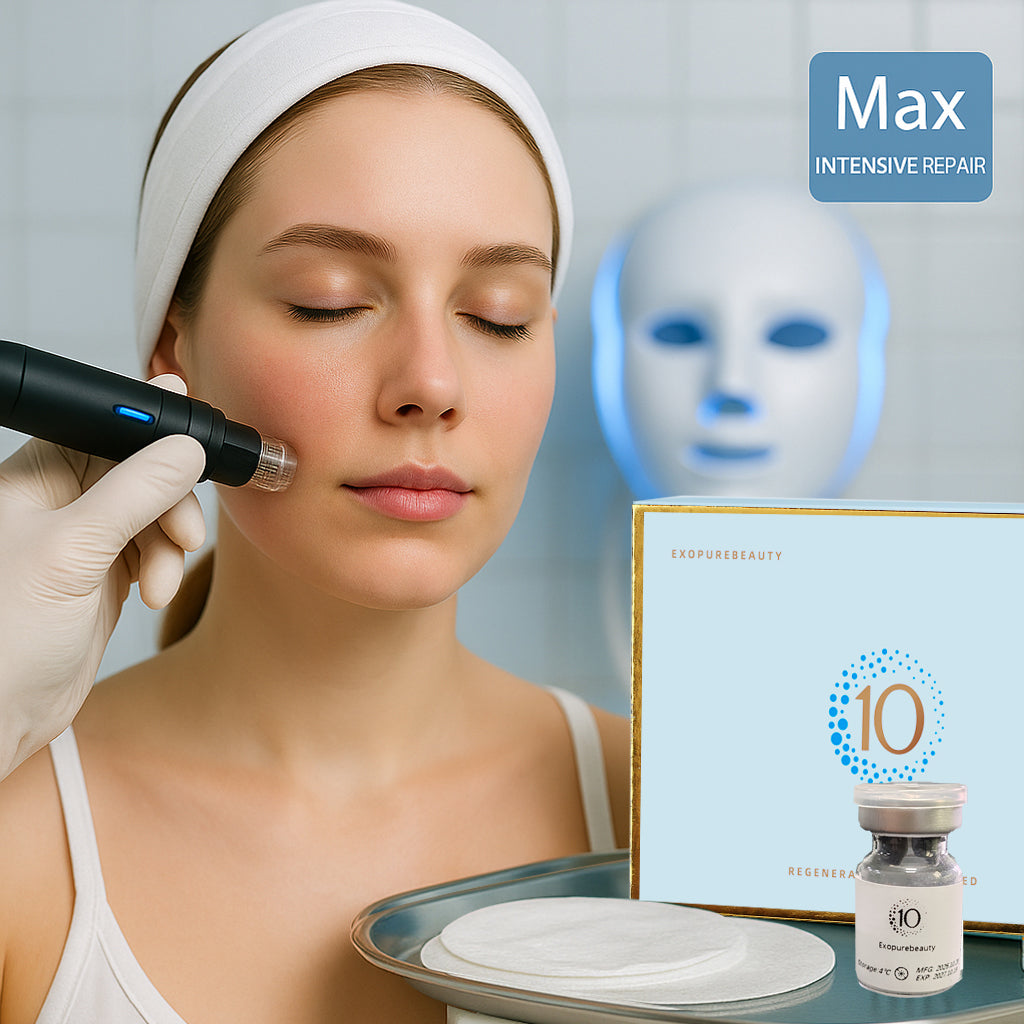
In practice: Microneedling + fresh-reconstituted exosomes tends to show Redness ↓ and TEWL ↓ immediately; Elasticity ↑ often appears over 2–6 weeks.
How to keep clean, comparable records at home
Set up the environment
-
Room: 20–24 °C, 40–60% RH; fixed light and camera position.
-
Cleansing: Wait 15–20 min post-wash before measuring/photographing.
-
Schedule: D0 (baseline), D3, D7, D14, D28; extend to D56 for longer courses.
Photo tips
-
Same phone/camera and focal length; three angles (front, L-45°, R-45°).
-
Choose 2–3 ROIs (e.g., malar area, beside alar, mandibular line).
-
If possible, split-face A/B: one side basics only, the other side with the target regimen.
Log the numbers
-
If you have home instruments: 3 repeats per ROI, average them.
-
-
Hydration ↑ = good
-
TEWL / Redness ↓ = good
-
Elasticity (R2/R7) ↑ = good
Change % = (Current − Baseline) / Baseline × 100%
-
-
Note daily variables: sleep (h), sun (min), exercise (min), cycle, alcohol (ml).
Typical noise sources
Weather swings, exercise/caffeine, hormonal phase, over-cleansing—all can transiently push TEWL/Redness up. Watch the trend line, not single points.
Turn numbers into purchase & scheduling decisions
-
Short-term stabilizers: Want Redness ↓ / tightness ↓ within a week? Track TEWL & Redness. If TEWL drops ≥15% by day 3–7 and redness eases, keep the cadence.
-
Glow-seekers: Care about makeup adherence? Watch Hydration; +10–15% by days 7–14 → move to maintenance (every other day / daily, per tolerance).
-
Early anti-aging: Check R2/R7 rising across 4–8 weeks. If it spikes at week 2 then plateaus, consider combo-projects or extending the course.
Visual cheat codes (reading reports fast)
-
Bar charts: Look at bar height gaps and error bars (shorter = more stable).
-
Line charts: Look for trend and turning points; TEWL often rises then falls post-procedure.
-
Box-whisker: Shorter boxes = less individual variability; median can be more reliable than mean.
-
p-value: p < 0.05 is common for significance—but effect size (how much it changed) is more intuitive.
One-page cheat sheet
-
Hydration (AU): higher = better; +10–15% = you can feel it
-
TEWL (g/m²/h): lower = steadier; >25 often impaired; −15–30% = noticeable comfort
-
Elasticity (R2/R7): higher = bouncier; +5–10% = visible
-
Redness: lower = calmer; compare the same ROI over time
-
Evidence: A > B > C > R; check design & sample first, then magnitude & time
-
Tracking: fixed light & points, 3× averages; D0 / D3 / D7 / D14 / D28
Bottom line
Efficacy data isn’t just an academic exercise—it’s your toolkit for clear choices. Once you understand Hydration, TEWL, Elasticity, and Redness, you can decode any brand’s report—and use your own numbers to verify whether microneedling + fresh-reconstituted exosomes is truly worth it.
Read more
Exosomes, scientifically proven as one of the most promising innovations in 21st-century skincare, are leading breakthroughs in regeneration and repair.
That foundation is why exosomes now show wide promise in skin and aesthetic contexts—and why many consider them one of the most important avenues for breaking through regeneration and repair bottle...